Stages of a trend
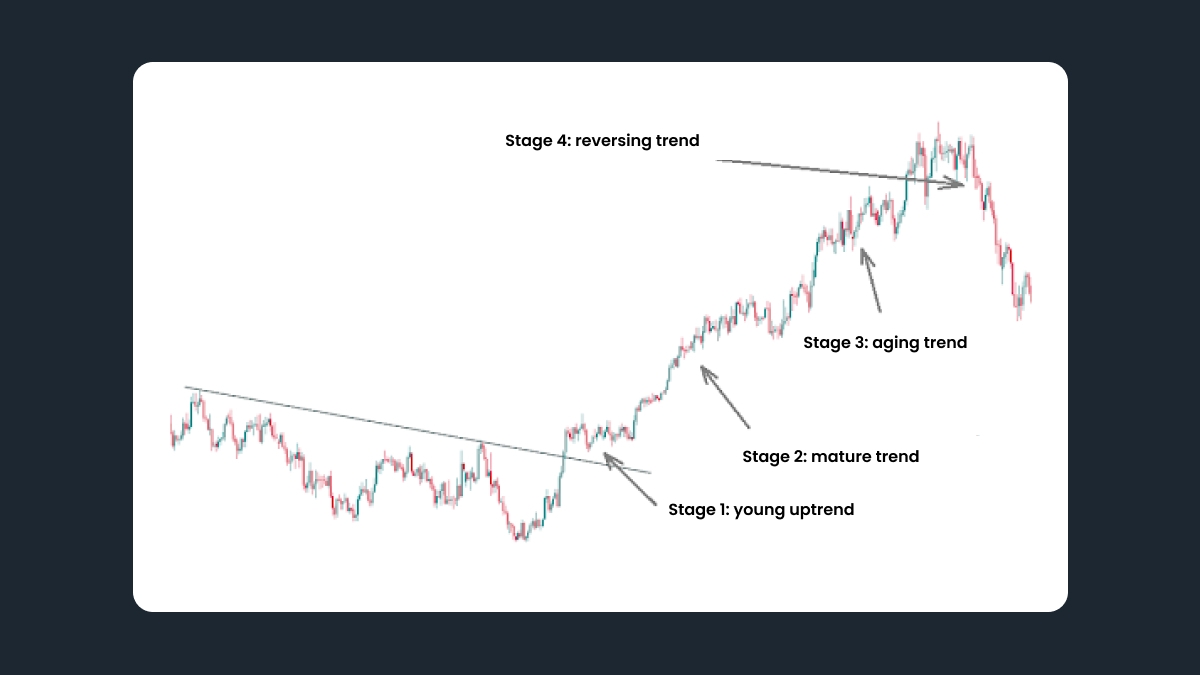
The next important thing is that every trend consists of 4 stages:
Young trend.
Mature trend.
Aging trend.
Reversing trend.
If a trend is already old, there’s no point in trying to trade it. The goal is to catch a trend at its beginning or during the early stage of its maturity. This way you will be able to get a good profit from trading the trend.
You should be looking for stage 2. At this point, you will be able to draw trend lines. For an uptrend, you will need at least 2 lows – the initial low and the higher low. If you have 3 lows to connect, that’s even better – it means that a trend really has formed. The trend line will be a support line. For a downtrend, you will need at least 2 highs – the first high and the second, lower high. As before, it would be even better to connect 3 highs. In that case, the trend line will be a resistance line.
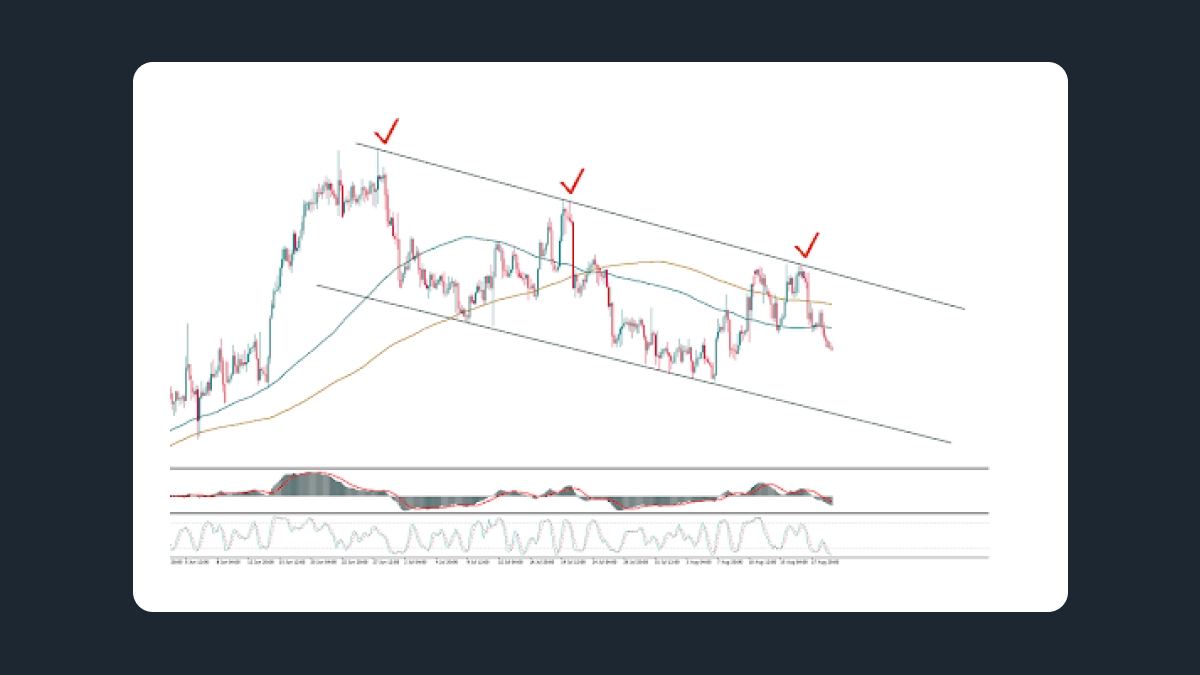
It’s very important that you don’t get lazy about making an effort to draw the trend lines. They represent a simple but efficient tool of chart analysis. Not only will they help to find the areas where the price may bounce from its support or resistance, but they will also show how strong the trend is. Go with this observation: the steeper the trend line, the higher the chances that the price will break through it. If the price moves rapidly up, buyers who push it higher will soon run out of strength, and the market will reverse. If you want to pick a good trend that will last for a considerable time, choose one with trend lines that are less steep.
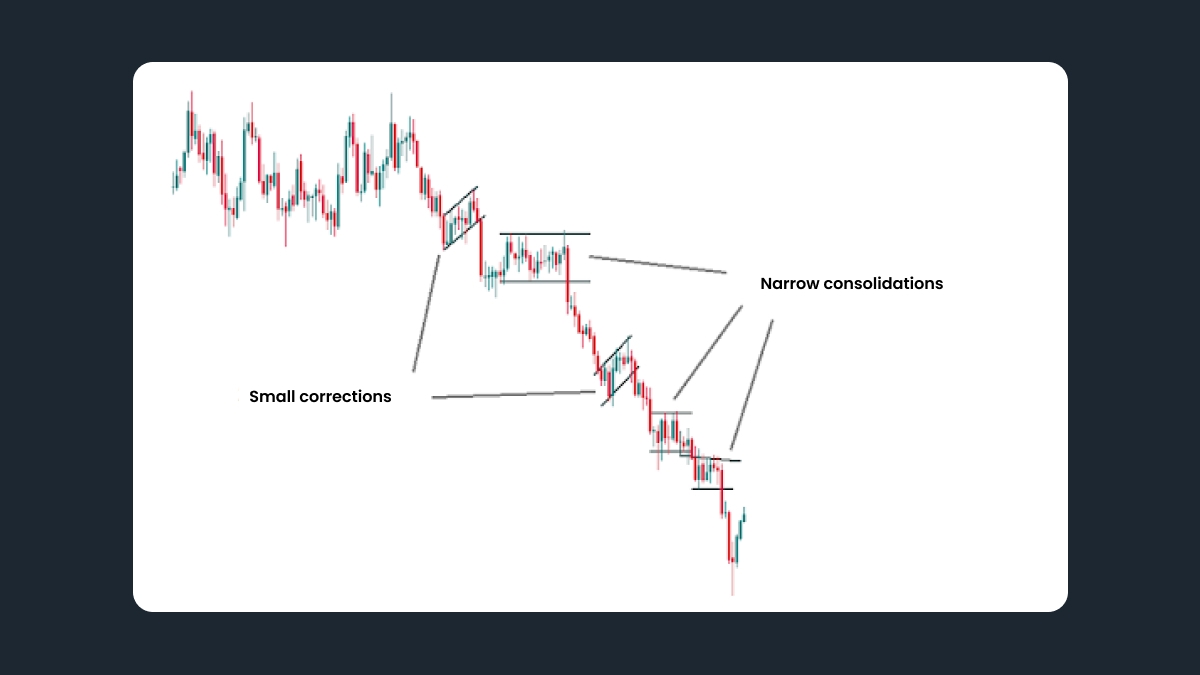
We also advise you to look at the corrections and consolidations that take place during your trends. As you can see, even when the price has a tendency to move up or down, it doesn’t go straight up or straight down all the time. A correction is when a currency pair pulls back in the direction opposite to that of the main trend. A consolidation is a period of horizontal price movement.
If the periods of counter-trend movement (corrections) are short and sideways ranges (consolidations) are narrow, you have found a solid strong trend that is safe to trade.
Technical indicators
There’s a group of indicators in MT4, called “Trend indicators.” These can help you ride a trend.
Moving average will help identify an uptrend or a downtrend and act as support and resistance. We recommend using simple moving averages with periods of 20, 50, 100 and 200.
ADX shows the direction and strength of a trend. Readings above 30 indicate a strong trend. Note that this indicator can be slow.
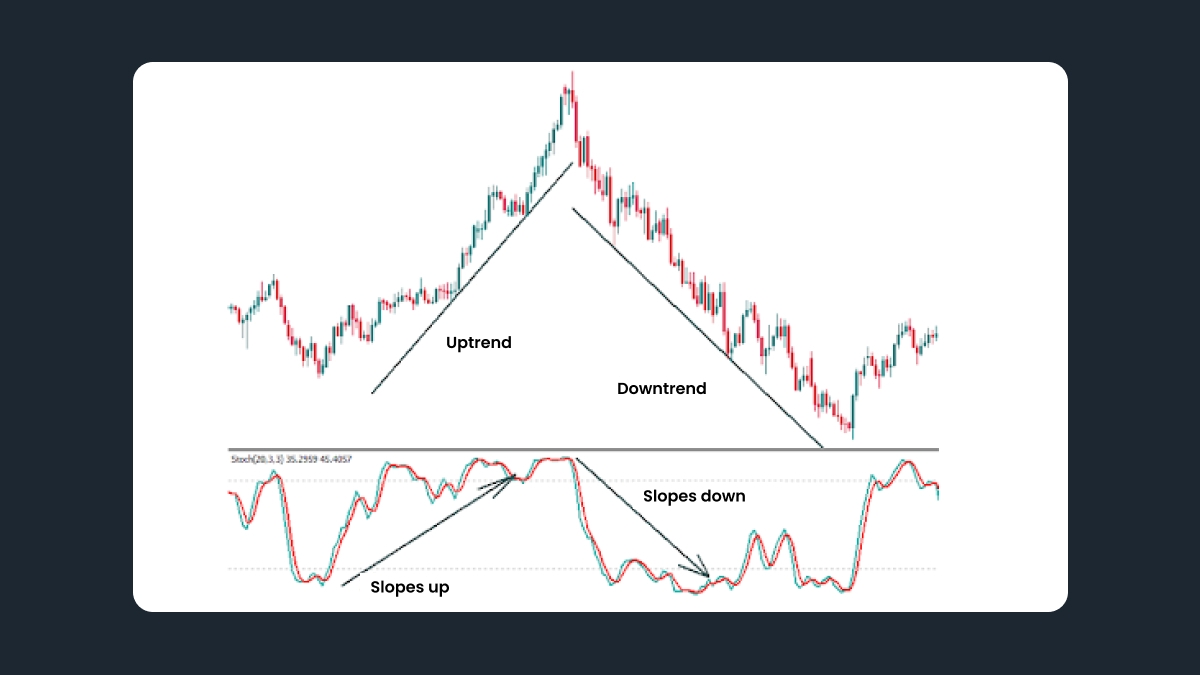
Traders can also use oscillators (indicators that oscillate around some central value and are shown in a separate window below the price chart). After you have determined the direction of the trend using trend lines or moving averages, check the Stochastic oscillator. In an uptrend, its slope should be strongly upward. In a downtrend, the Stochastic has to slope strongly down. If the price is making new highs in an uptrend, but the Stochastic is not, this may signal a reversal down.
You can get similar data to that provided by the Stochastic indicator from another oscillator called MACD. The difference is that MACD comes in the form of a histogram (columns below the price chart). During an uptrend, MACD columns should become bigger, while during a downtrend they should decline and then get to the negative area.
A strategy for trading using a trend
The best way is to go along with the market. Here are the recommended steps:
Determine how long you want to stay in the trend. This decision will influence the timeframes you choose for trading. If you decide to trade intraday (i.e. for up to several hours only), determine the trend on the daily timeframe. You can also use H4 and H1 charts to plan your trade. We don’t recommend wasting time on smaller timeframes like M15, as the situation there changes too fast to make a good analysis for a trade that will be open for several hours.
Identify the trend – is it an uptrend of a downtrend? Check economic news and analytics, try to understand which fundamental (economic) factors or news stand behind this trend. Can it be that the market is anticipating an important event? Or maybe something has already happened and is having an impact on the market? If the market sentiment is bullish, then you can buy in an uptrend. If it’s bearish, you can sell in a downtrend.
Draw trend lines. Are they steep or normal? How many times did the price test the trend line? If the price touched the support line for the third time in an uptrend and pulled back up during an uptrend, it’s a signal to buy.
Check technical indicators. Make sure that they confirm the trend.
Determine the stage of the trend. Trading at the very beginning or at the end of the trend is risky, it’s better to pick a nice mature trend.
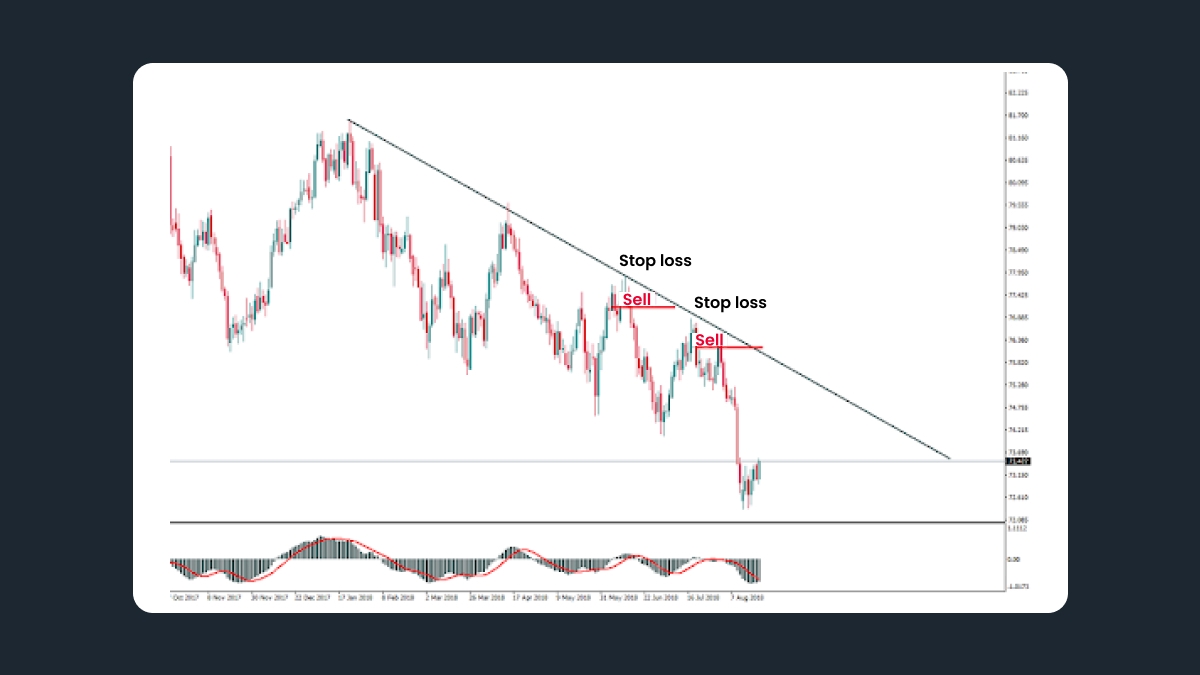
Put a limit order near a trend line. In an uptrend, place a buy limit at the support line. In a downtrend, place a sell limit near the resistance line.
Place a protective stop-loss on the other side of a trend line. Your stop-loss shouldn’t be too tight so that your order doesn’t close simply because of daily volatility. There’s no universal solution for choosing a stop-loss. Much will depend on how long you aim to hold your trade (you need to have an idea where you will close your trade with profit) and on your trade size. Usually a stop-loss is about 1/3 of the potential take-profit. All in all, for an intraday trade that lasts several hours it is better to have a stop-loss that exceeds 15 pips.